Balancing Martech with Google’s Core Web Vitals Update
Balancing Martech with Google’s Core Web Vitals Update
Princess Allen | Associate Strategist
August 24, 2021
Core Web Vitals (CWVs) have been a trending topic ever since early May 2020, when Google announced that Largest Contentful Paint (LCP), First Input Delay (FID), and Cumulative Layout Shift (CLS), would join mobile-friendliness, safe-browsing, HTTPS, and intrusive interstitial guidelines as page experience signals that measure how users perceive the experience of interacting with a web page.
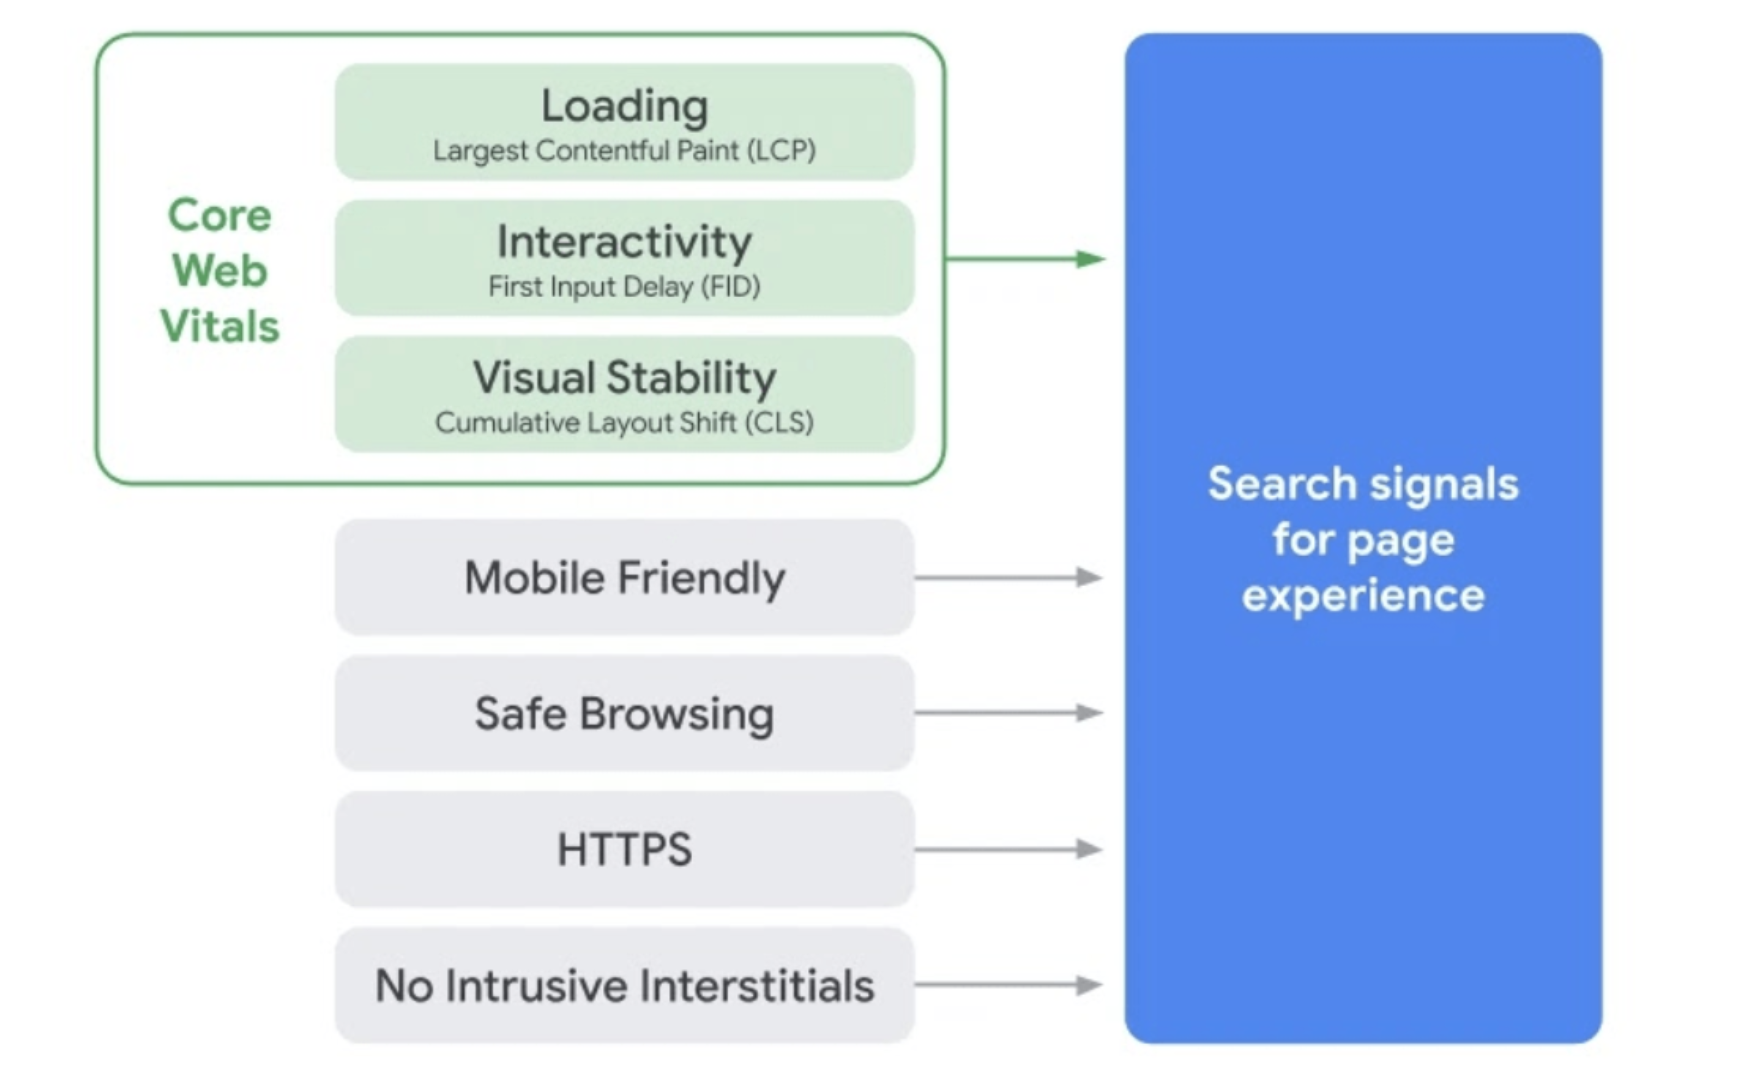
LCP, FID, and CLS measure real-world user experience for loading performance, interactivity, and visual stability of a page, respectively. Modern users are looking for a faster, more responsive, and more stable page experience.
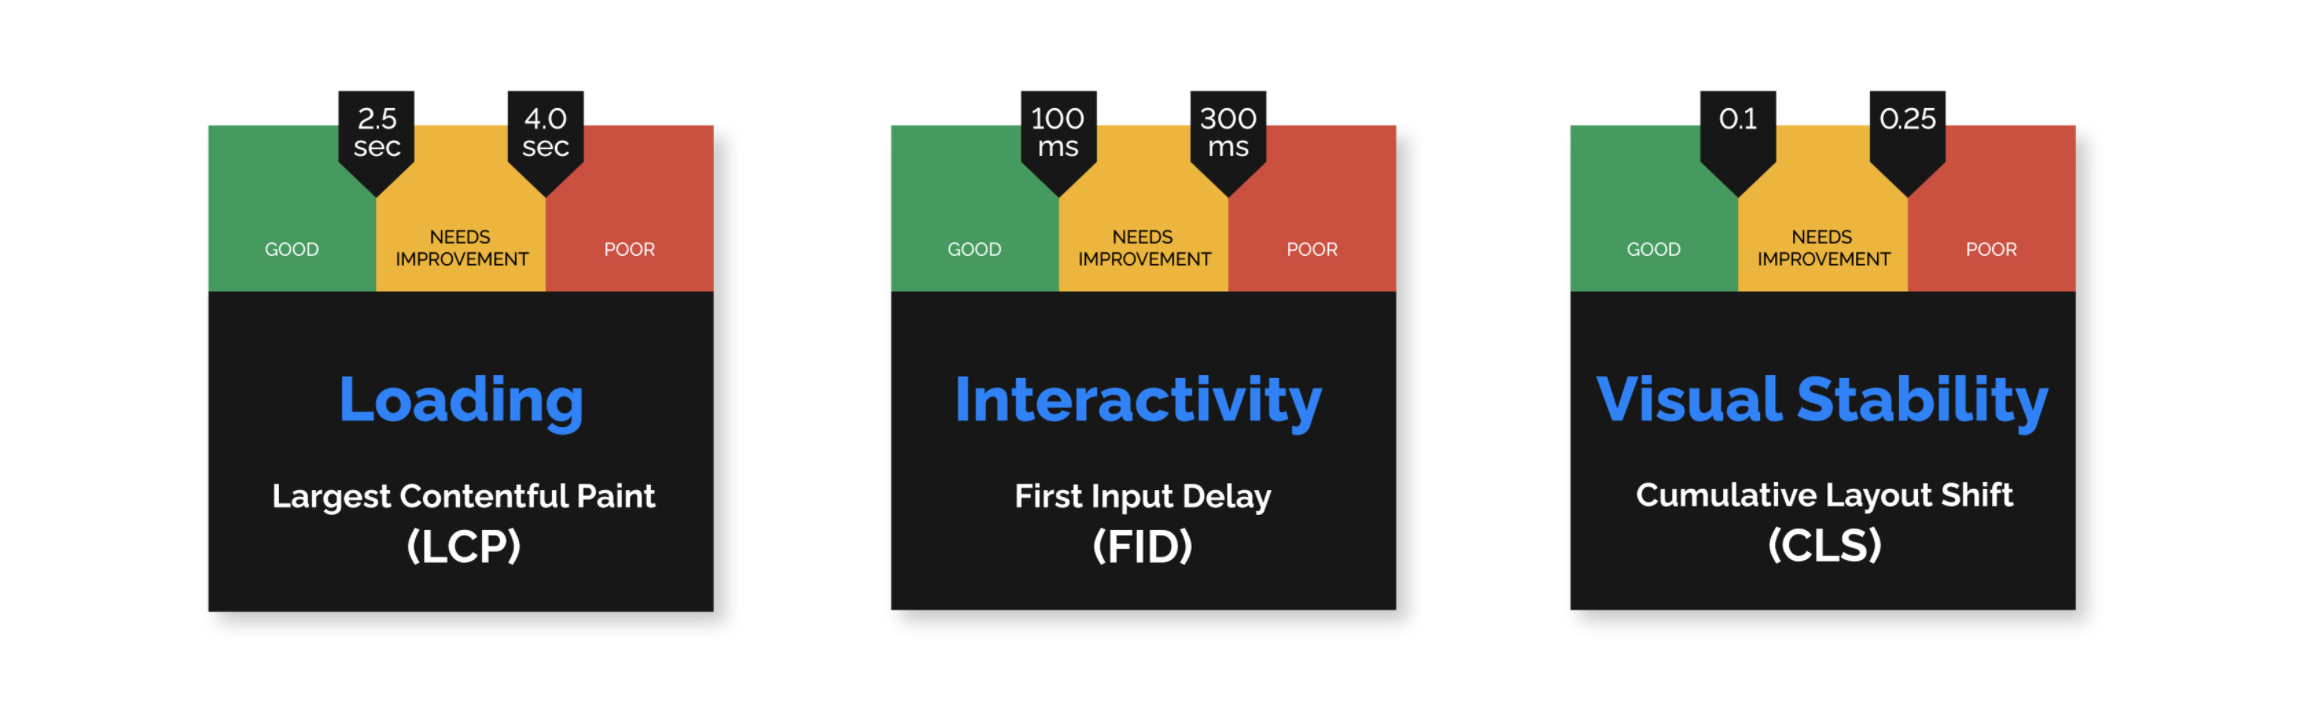
Google’s decision to now add CWVs to its ranking factors underscores how important user experience is to a website's expertise, authority, and trustworthiness. Google is evaluating websites against the following CWV best practices:
- LCP should optimally be below 2.5 seconds of when the page first starts loading.
- Pages should have a FID of 100 milliseconds or less.
- Pages should maintain a CLS score of 0.1. or less.
As Google continues to determine where websites rank in search results based on their performance score, digital marketers are concerned about the CWV update. Some factors that have been found to now contribute to a lower performance score include:
- insight-generating third-party plug-ins or tracking scripts like Google Tag Manager and Google Analytics, and
- optimization tactics like A/B testing.
Pictured below is an example of an actual website's mobile performance score.
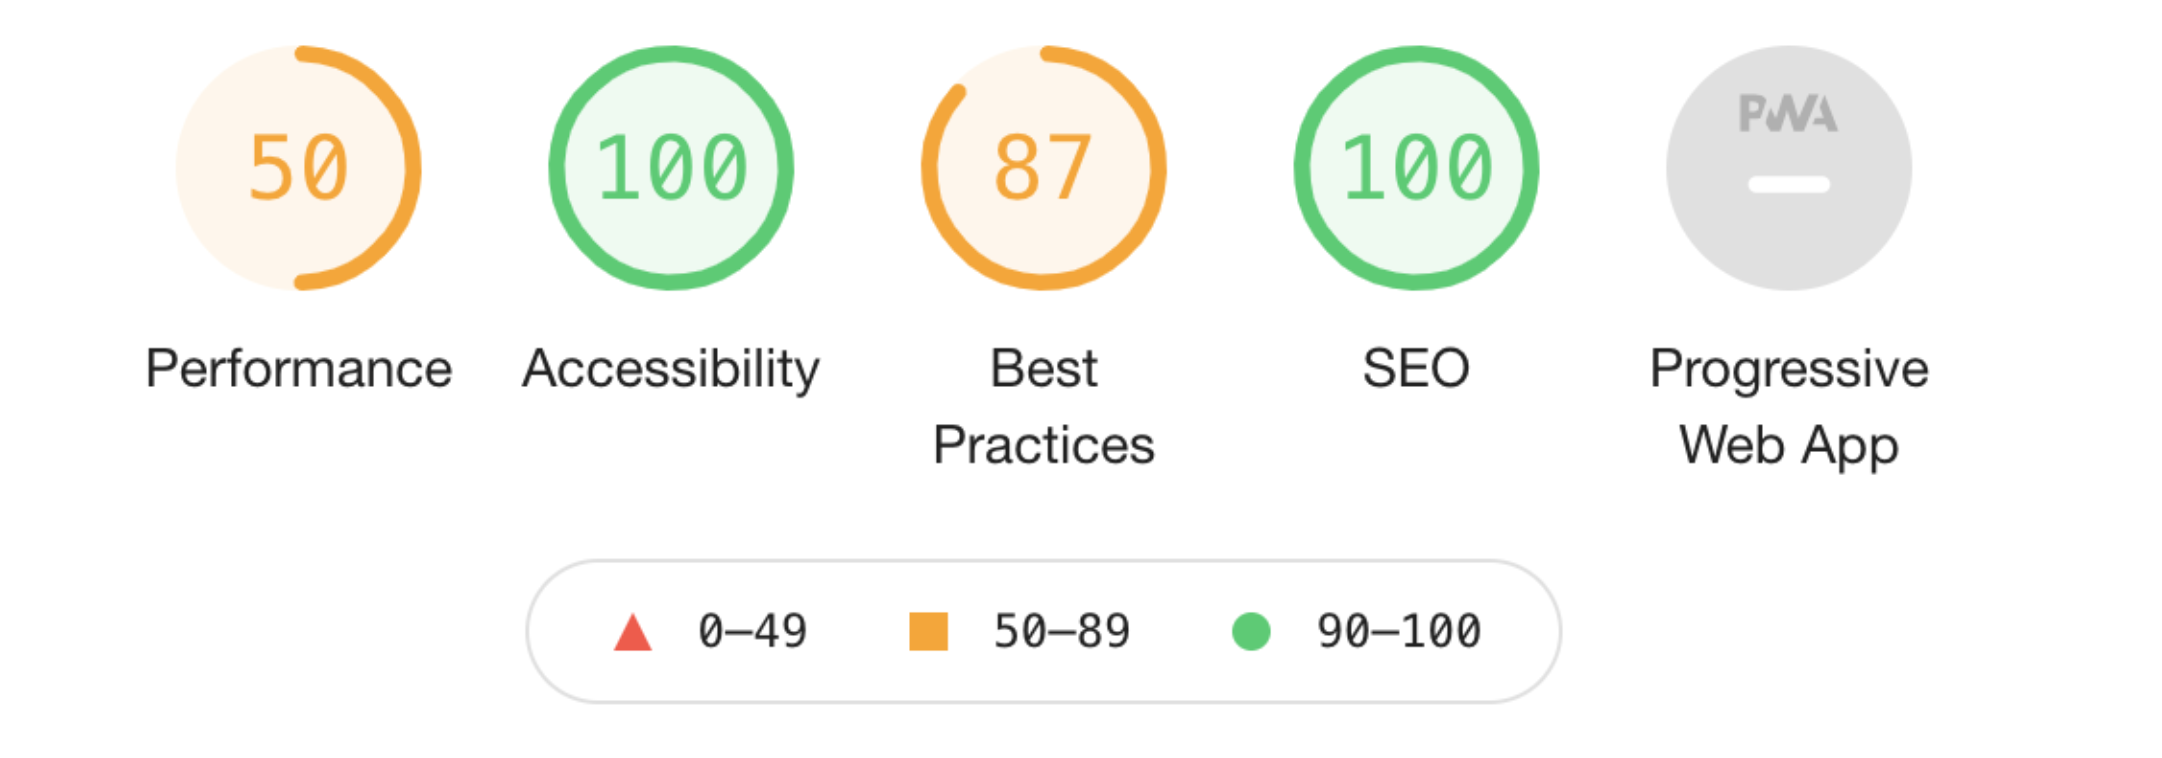
Performance is an area where it is harder to score 90 and above. It is easier to move into or within - and conversely, to drop out of - the needs improvement range than it is to move within the good range. One situation that explains this phenomenon is when a site-wide change, say a dramatic increase in site traffic, boosts enough borderline pages. For this reason, we recommend considering where your score falls before blindly adopting Google’s recommendations, which may not move the needle by very much. The key to balancing marketing goals with the dynamic algorithm changes that Google makes is to consider your goals, the value of the gained insights, and your user’s situation (i.e., device, operating system, browser).
For example, one way for marketers to score better in CWV is to strip out any metrics tracking from their site, but we don’t advise doing this because one of your goals is to gain insight into your user’s experience. That experience is what shapes your user’s perception of and relationship with your brand, and that affects your revenue. Publishers and marketers should instead construct pages that are as fast and responsive as possible while still achieving business goals and allowing marketers to track progress toward those goals. Likewise, it may be worthwhile to sacrifice insight into some specific metrics if improving the CWV scores results in higher ranking in Google’s search engine result’s pages.
At Phase2, our Customer Data & Insights team can help you address the issues that result in poor CWV scores, such as slow loading, unresponsiveness, and unexpected page shifts, without sacrificing the convenience of managing marketing technology (martech) tags with Google Tag Manager. We can provide insights by analyzing martech solutions such as Google Analytics, and - in conjunction with our User Experience team - insights gained through user experience testing such as A/B testing. We do this by:
- auditing your marketing analytics tags, removing those that are defunct or upgrading those that are antiquated,
- mapping out your digital experience landscape (DX Landscape),
- connecting and configuring martech,
- optimizing touchpoints for conversions, and
- generating or improving on reporting dashboards.
After all, there is just as much business value in knowing exit rates, conversion rates, and bounce rates as there is in the perception of a fast loading, quick responding, and stable website.
We hope you enjoyed reading the Phase2 blog! Please subscribe below for regular updates and industry insights.