Open Source Tool Sets for Creating High-density Maps
Open Source Tool Sets for Creating High-density Maps
Brandon Morrison | Senior Developer
August 6, 2013
A few weeks ago I wrote about some of the building blocks available to create engaging maps in Drupal. The module ecosystem around maps and other geospatial functionality is pretty flexible, but there are some situations where Drupal might not be the best fit. There are some great tools out there to build out sites when the situation calls for little else besides a map display, or when processing and rendering tens of thousands of geospatial features. In this blog post, I'm going to talk about two in particular, Mapbox and CartoDB.
Mapbox
Mapbox is a great map building tool that allows for the creation of pre-rendered mapping displays with a set of web-friendly tools. With their map creation application Tilemill, you can take arbitrary data layers and render them onto a single map. Their map hosting service provides a very usable interface for managing and even combining maps into a single layer from the web interface. Styling maps in Tilemill is handled through a language called CartoCSS, which shares many syntax similarities to CSS and Sass. This makes the map making process very accessible to designers and people without formal GIS training in general. Recent improvements to CartoCSS even allow for some interesting effects like blending modes and subtle feature manipulation to allow for some very interesting map displays.
CartoDB
CartoDB is a mapping stack that has many similarities to Mapbox. Both provide excellent ways to create engaging web accessible maps. Both allow for map styling via CartoCSS. The main difference between the two mapping stakcs is that CartoDB renders map layers on the fly instead of pre-rendering everything. Combined with their client-side API, CartoDB can be used to build maps that allow for more complex interactions. Like anything in life, there are tradeoffs. What you gain in flexibility with CartoDB you lose in speed, especially for extremely large datasets or complex queries.
Real-word Mapping Example: Finding Apartments in NYC
It's easy enough to talk about the strengths and weaknesses of Mapbox and CartoDB, but the best way to really get a feel for the services is to try them out yourself. Finding an apartment in NYC can be an ordeal. Despite the fact that there are tens of thousands of units in the city, demand is so high that finding a place to live is extremely competitive (and pricey!) But where exactly are these apartments in the city? I found an interesting dataset on Geocommons, which shows the locations of apartment complexes in the NYC area. Each entry has information on the number of units in the complex, the number of floors in the building, the address, who runs the building, and which borough the building is located. I've converted the dataset to GeoJSON to make it easier to import into both Mapbox and CartoDB.
Mapbox
Step 1. Install Tilemill
Tilemill is the Mapbox tool of choice for creating maps. It's a desktop application that will run on Windows, OS X and Linux. Go to http://www.mapbox.com/tilemill/ and download the package for your OS.
Step 2. Set up a new project
Once you've opened up Tilemill, you'll need to create a new project to hold your map. Click on the new project button. Name the project "apartment - demo" You don't need the default world data and styling, but you can leave it if it's helpful to orient yourself.
Step 3. Import your data
You can grab the apartment dataset from my github repo. Once you have the apartment data, you'll need to add it to your project. Click on the "Add layer" button, and use the file selector to import the data onto the map.
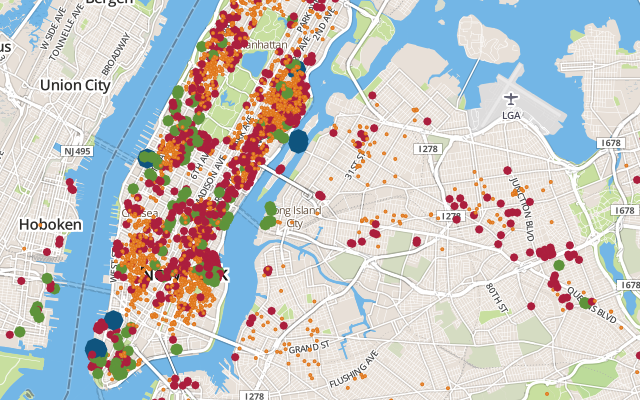
Step 4. Style your data
Map styling happens by attaching CartoCSS stylesheets to the map project. The syntax for CartoCSS should look familiar to anyone who has used Sass, Less, or CSS in general. For this project, I've created a starter stylesheet for you, but you should definitely check out the bundled documentation with Tilemill. By the time you're done, your map should look something like this.
CartoDB
Step 0: Sign up for a CartoDB account
Go to CartoDB.com and sign up an account. For the purposes of this demo, a free account will suffice.
Step 1: Create a new table
CartoDB works off of a database model, and the UI pushes for map displays consisting of a single table, like an Excel spreadsheet. Click on the "New Table" button on the right side of the page. The popup that comes up will allow you to directly import a file to populate your new project. Upload the apartment GeoJSON file from my Github repo. It's been my experience that uploading files of data for display will always import individual columns as strings. This is probably fine in most cases, but if you want to ever filter your data on any numeric or date type queries (i.e., show me every apartment complex with more than 6 stories), then you'll need to convert that column to the appropriate data type. You can do this in the data display by clicking on the arrow next to the column name, then choosing "Change data type..." In CartoDB, you have the option to choose either string, date, numeric, or boolean data types.
Step 2: Create a visualization of your data
Once your data's set, click on the "Visualize" button on the top right of the page. This will create a map display based on your database table. From here, you'll probably want to adjust the default styling. CartoDB comes with the ability to do some interesting visualizations out of the box like hexagon-based density maps and faux-heat maps. At their heart, however, these displays are based on CartoCSS and some PostGIS magic. Feel free to play with the prebuilt displays from CartoDB, or you can also use my prebuilt CartoCSS built specifically for this exercise.
Step 3: Make it interactive
At this point, you should have a great looking static map from CartoDB. However, we're only beginning to touch CartoDB's potential as a dynamic mapping stack. From an API perspective, they expose the ability to query data tables with SQL. Combined with their mapping library (which implements a Leaflet.js plugin and a Google Maps plugin for data layers) it's relatively easy to code up an interactive map display. Check out a simple example I created that allows users to filter the map based on the borough and the number of floors and units in each apartment building. Make something awesome using MapBox or CartoDB and show it off by posting in the comment section!