Help, I Can’t Get Beyond Basic KPIs!
Help, I Can’t Get Beyond Basic KPIs!
Karina Schuelke | Director of Digital Strategy
April 1, 2020
You need meaningful Key Performance Indicators (KPIs). You know it, I know it... everyone knows it.
But, creating meaningful KPIs is like eating a healthy diet. Everyone knows you should do it, but no one agrees on how to do it. It’s easy to come up with ideas for things to measure, but a lot harder to choose KPIs that really make a difference to your organization.
Meaningful KPIs will be tied to your business goals and go beyond mere numbers - they need to be actionable. In other words, they need to lead to insights. When you review your KPIs for a campaign, your product funnel, or your lead generation process, they need to come together to form a story and to create a path of exploration and analysis. They need to reveal an insight and guide you toward opportunities for improvement and testing.
That is much harder than just tracking pageviews (or eating your brussel sprouts). So where do you start when you create your KPIs?
Get Smart
If you’ve been around the analytics world for any length of time, chances are you’ve seen the powerful digital marketing and measurement model diagram in the classic blog post from Avinash Kaushik. The digital measurement model is intended for anyone looking for an objective set of measurements for their campaign or marketing program(s).
In the post, he talks about a number of incredibly important topics, but one of the most important is the need for smart KPIs that truly indicate success or failure according to your organizational goals and KPI targets.
(Important side note: everyone winds up needing to track some KPIs that are not the most important and most valuable because that’s what they get asked about by executives and other stakeholders. It’s okay - just embrace it, and make sure that as many of your KPIs as possible provide a high level of value.)
Avinash 2.0
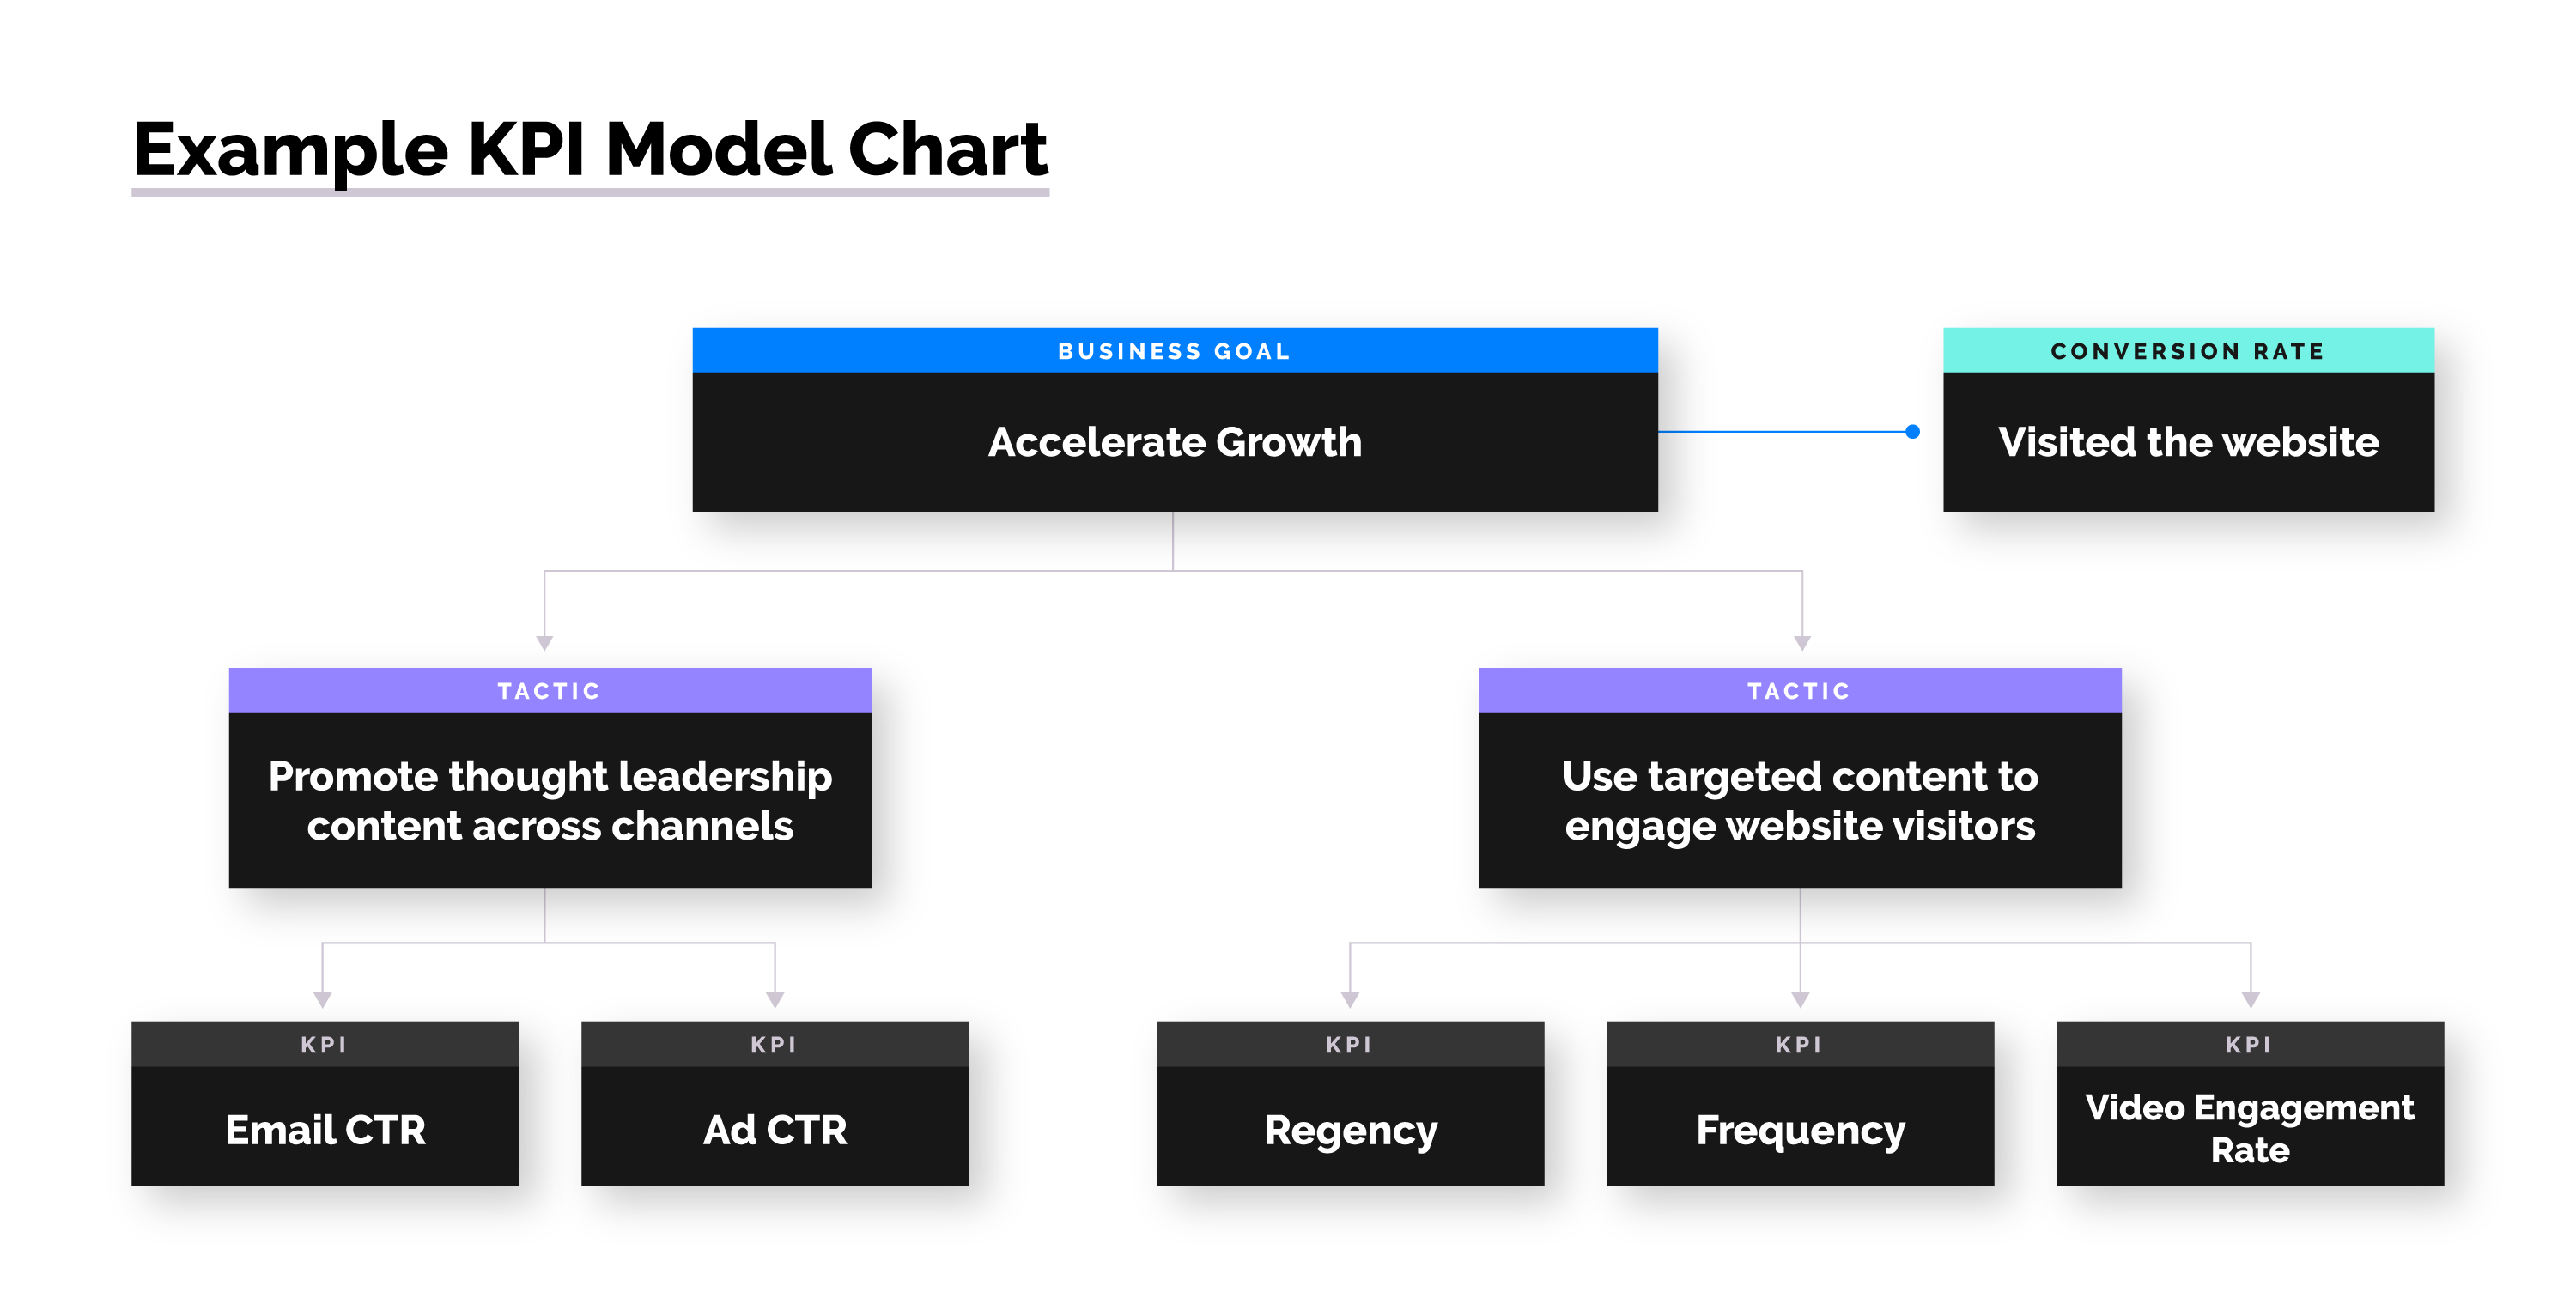
With our own clients, we’ve adapted Avinash’s model and developed our own version of this diagram. At Phase2, we delve further into the relationships between different KPIs and also call out separately the actions we plan on taking relative to the goals. As a result, we're able to draw clear connections between the organizational goal, the action we take to achieve that goal, and the KPI used to measure the effectiveness of that action.
For example, let’s say your business goal is to nurture prospects through digital means, with a conversion goal of getting them to download a specific piece of content. The actions will likely hone in on content engagement prior to accessing the gated content, as well as actions that will encourage those downloads. Our clients typically think about their goals as downstream conversions, so we also capture the conversion for a specific model as a separate point.
Here is a screenshot of our model:
The Buy-In
As you work with this model, it’s critical to socialize it through the organization. People behave how they’re measured, and they will fight to ensure that they are measured against targets they believe they can hit.
For example, if an individual is measured against the number of Leads they produce, they will be very picky about the definition of a Lead so they can be sure they will hit their numbers. In light of this reality, processes that allow employees to be successful matter enormously. Technology that empowers employees, designed to track the data you want to measure, is essential. Building the right data model is the first step - the next step (of which socialization is just one part) is to bring it to life.